Consumer Behavior Data Resources
Understanding Consumer Behavior Data
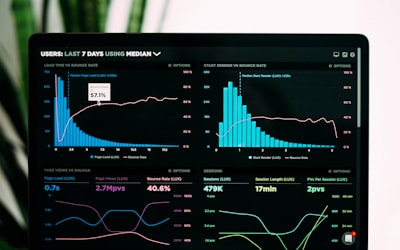
Source: Statista E-commerce Overview
Consumer behavior data encompasses the study of how individuals, groups, and organizations select, buy, use, and dispose of goods, services, ideas, or experiences. This data area is crucial for businesses seeking to understand their customers and make informed marketing, product development, and strategic decisions.
The types of consumer behavior data available include: transactional data (what people actually buy, when, and how much they spend), behavioral data (how people interact with websites, apps, and advertisements), attitudinal data (survey responses about preferences and satisfaction), and demographic data (age, income, location, and lifestyle characteristics that define consumer segments).
Modern data collection methods have revolutionized this field. Point-of-sale systems track every purchase, websites monitor click patterns and browsing behavior, and social media provides real-time sentiment analysis. Researchers can now access insights that were impossible to gather just a decade ago, enabling more precise targeting and personalization than ever before.
Resource 1: Statista

Site: Statista - Consumer Market Outlook
URL: https://www.statista.com/outlook/cmo/ecommerce/united-states
Statista is one of the world's leading statistics portals, providing access to data from over 22,500 sources. Their Consumer Market Outlook section offers comprehensive forecasts and market data for consumer goods and services across multiple industries and countries.

View on Statista
Statista excels at providing industry-specific key performance indicators (KPIs) that enable comparison across markets and time periods. Users can access data on average revenue per user (ARPU), market penetration rates, year-over-year growth figures, and demographic breakdowns that are essential for strategic planning.
For consumer behavior research, Statista is particularly useful for understanding market size and growth trends. A researcher could use this resource to answer questions like: "How large is the e-commerce market in the United States?" or "What is the projected growth rate for online grocery shopping?" The platform provides both historical data and forecasts up to five years ahead.

View Internet Shopper Statistics
The insights a motivated consumer can gain from Statista include: identifying which product categories are growing fastest, understanding how consumer spending varies by age group or income level, benchmarking against industry averages, and spotting emerging trends before competitors. For example, tracking the growth of mobile commerce versus desktop shopping reveals shifting consumer preferences that brands must adapt to.
Resource 2: Think with Google

Site: Think with Google - Consumer Insights
URL: https://www.thinkwithgoogle.com/consumer-insights/
Think with Google offers consumer insights derived from Google's vast repository of search and browsing data. The platform provides real-time information on what consumers are searching for, how their interests evolve seasonally, and what factors influence their purchasing decisions across the customer journey.

View on Think with Google
A unique strength of Think with Google is its focus on the consumer journey—from initial awareness and research through consideration to final purchase. The platform publishes studies showing which touchpoints matter most at each stage, helping marketers understand where to focus their efforts and advertising spend.
Think with Google also features industry-specific reports that combine search data with survey research. Whether you're interested in retail, automotive, travel, or finance, these reports provide deep dives into how consumers in specific sectors behave online and what drives their decisions.

View Journey Research
The insights available here include: understanding what questions consumers ask when researching products, identifying seasonal trends in search behavior, discovering which content formats perform best at different journey stages, and learning how mobile versus desktop usage varies by category. For instance, a brand could discover that consumers searching for "best running shoes" often follow up with searches for specific features like "cushioning" or "arch support," informing their content strategy.
Resource 3: NielsenIQ

Site: NielsenIQ - Consumer Intelligence
URL: https://nielseniq.com/global/en/insights/
NielsenIQ is the gold standard for consumer packaged goods (CPG) data. Their panel-based measurement system tracks actual purchase behavior across millions of households, providing the most accurate picture of what consumers are actually buying—as opposed to what they claim to buy in surveys.

View on NielsenIQ
The platform offers detailed market share analysis showing how brands perform against competitors within specific categories. This includes data on distribution, pricing, promotion effectiveness, and market penetration that are essential for competitive strategy development.
NielsenIQ's insights cover both brick-and-mortar retail and e-commerce channels, enabling researchers to understand how shopping behavior varies across touchpoints. Their omnichannel view is increasingly important as consumers blend online and offline shopping experiences.

View Panel Methodology
Key insights from NielsenIQ include: understanding actual market share and how it changes over time, identifying which price points drive the most volume, measuring the effectiveness of promotional campaigns, and tracking how new products perform after launch. The platform's price elasticity data reveals how sensitive consumers are to price changes, helping brands optimize their pricing strategy.
Sample Analysis: Understanding E-commerce Growth Trends
To demonstrate how these resources work together, let's walk through a sample research question: "How has consumer e-commerce behavior changed in recent years, and what does this mean for retail brands?"
Start by visiting Statista's E-commerce Market Outlook. Here you can find that US e-commerce revenue has grown from approximately $430 billion in 2020 to over $875 billion projected by 2026. The data shows a compound annual growth rate (CAGR) of around 11%, indicating sustained consumer shift toward online shopping.

View E-commerce Data
Next, use Think with Google to understand what's driving this behavior change. Their consumer insights reveal that convenience, price comparison ability, and product variety are top motivators. Search data shows increasing queries for "same-day delivery" and "buy online pickup in store," indicating consumers want flexibility in fulfillment options.
Finally, NielsenIQ's retail measurement data confirms these trends with actual transaction records. Their insights show that categories like grocery and household essentials—traditionally purchased in-store—have seen dramatic e-commerce growth. The data also reveals that consumers who shop both online and in-store (omnichannel shoppers) spend 30% more annually than single-channel shoppers.

View Omnichannel Insights
Key Takeaways from This Analysis
By combining these three resources, a researcher can draw several actionable insights:
1. The shift to e-commerce is structural, not temporary. Statista's long-term projections show sustained growth, not a temporary spike. Brands need to invest in digital capabilities for the long term.
2. Convenience drives behavior more than price. Think with Google's search data shows consumers prioritize fast delivery and flexible options. Competing on convenience may be more effective than competing on price alone.
3. Omnichannel strategy is essential. NielsenIQ's data proves that the most valuable customers use multiple channels. Brands should create seamless experiences across online and physical touchpoints rather than treating them as separate businesses.
This type of multi-source analysis provides a complete picture: the "what" (Statista), the "why" (Think with Google), and the validation (NielsenIQ). Together, these resources enable evidence-based decision making for marketing strategy, retail operations, and brand development.
Page created for ACAD-274: Designing Interactive Data Systems | USC Iovine and Young Academy